Make car travel measurable
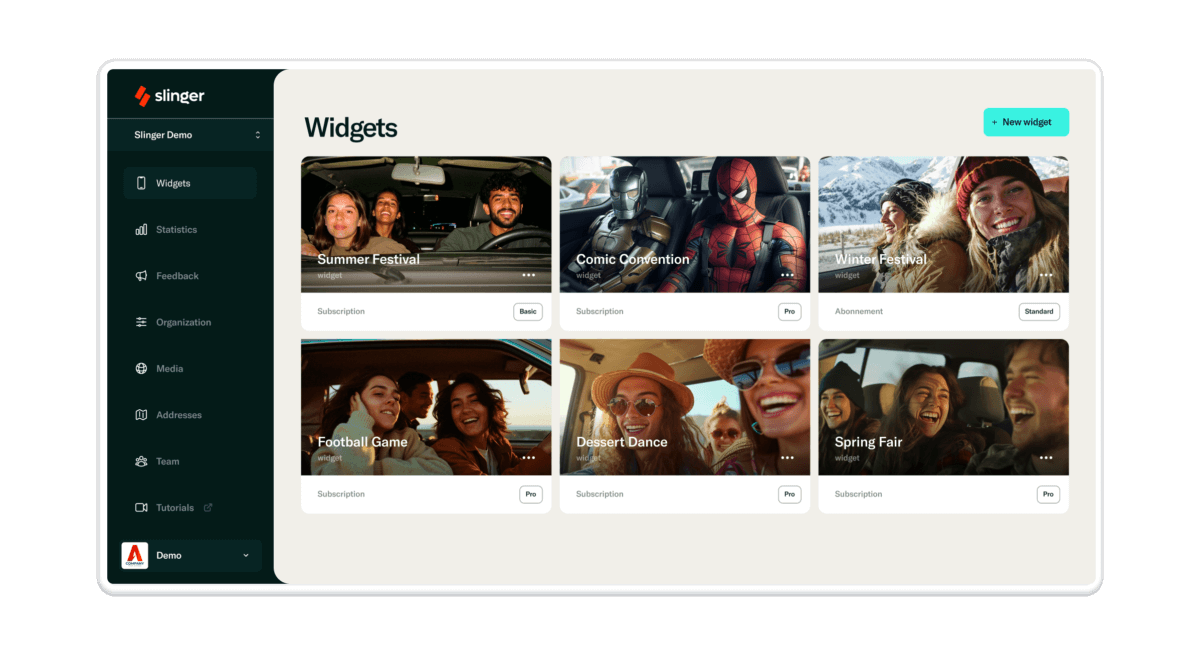
Every event organizer wants full control over what's happening, but visitor car travel is often a black box. Our dashboard shows who’s sharing their rides, from where and provides CO2 reporting.


Measure your impact
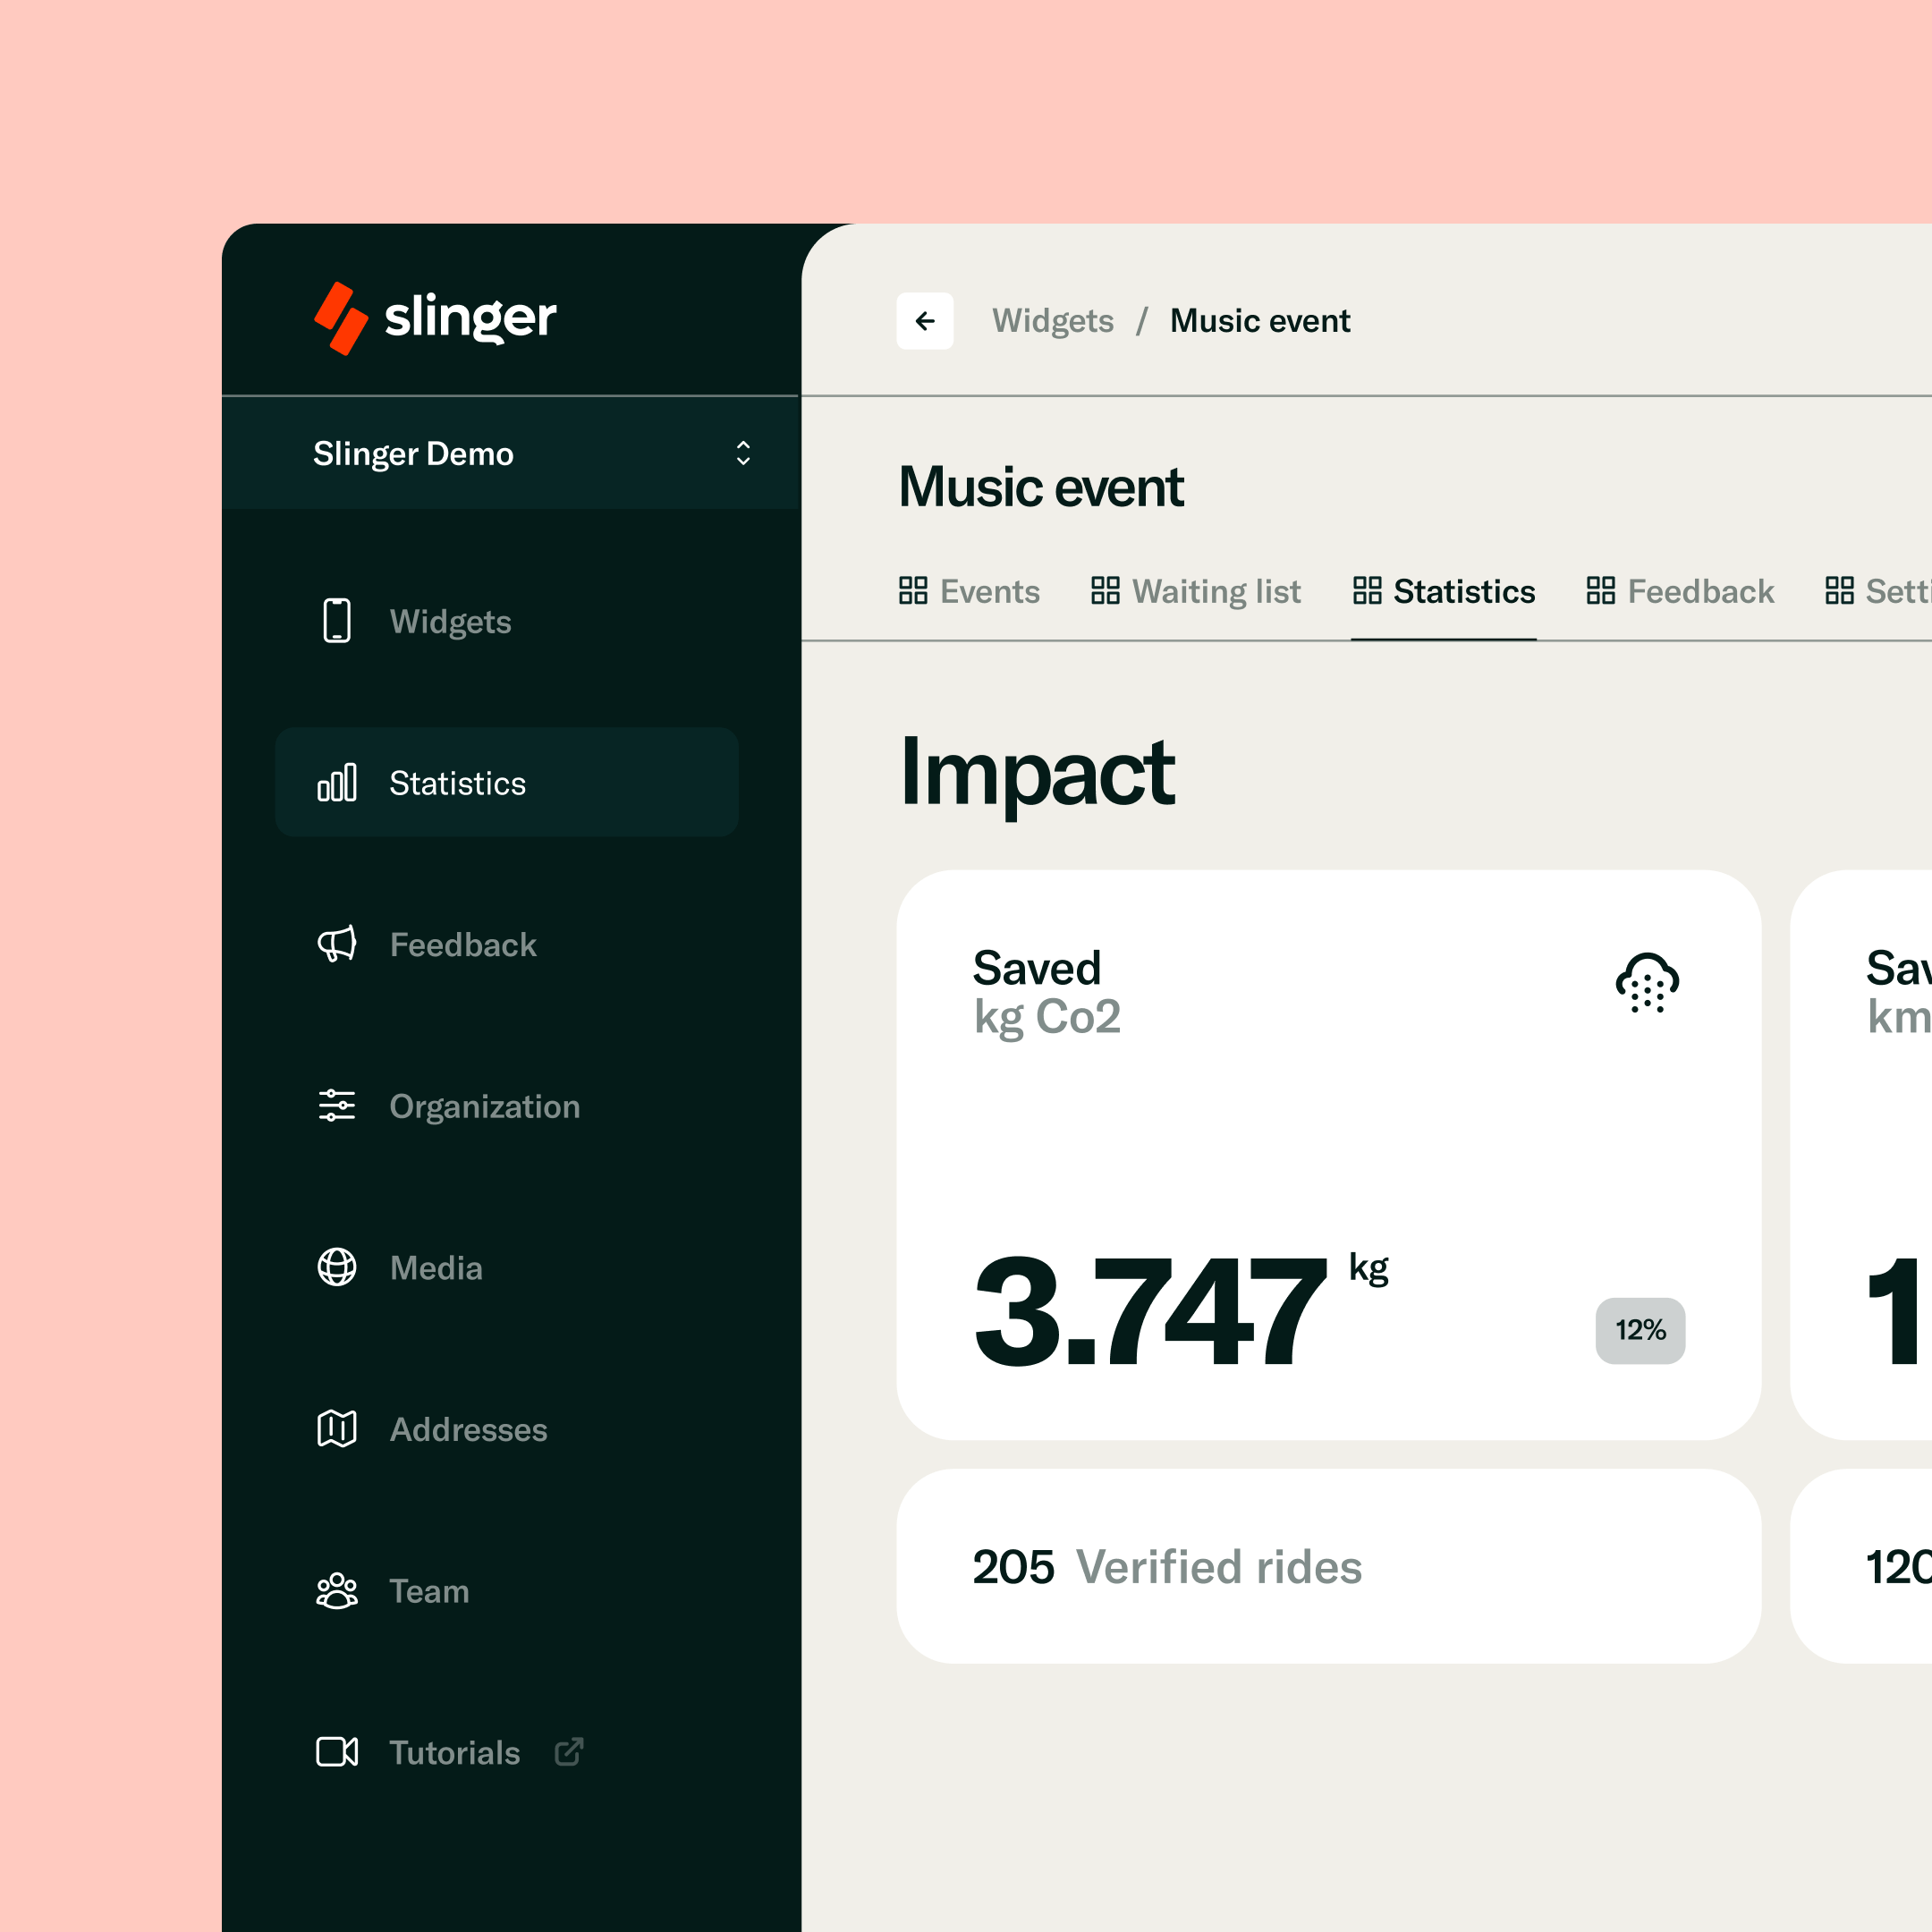
Understand how your audience moves. Monitor ride activity, measure kilometers traveled, and access CO2 reduction reports all aligned with ESG goals to make your sustainability efforts measurable and actionable.
Small Widget
Big Impact
Our widget is customizable and integrates effortlessly into any website or app in under 5 minutes.
Read moreAll features included. No extra costs.
Custom event settings
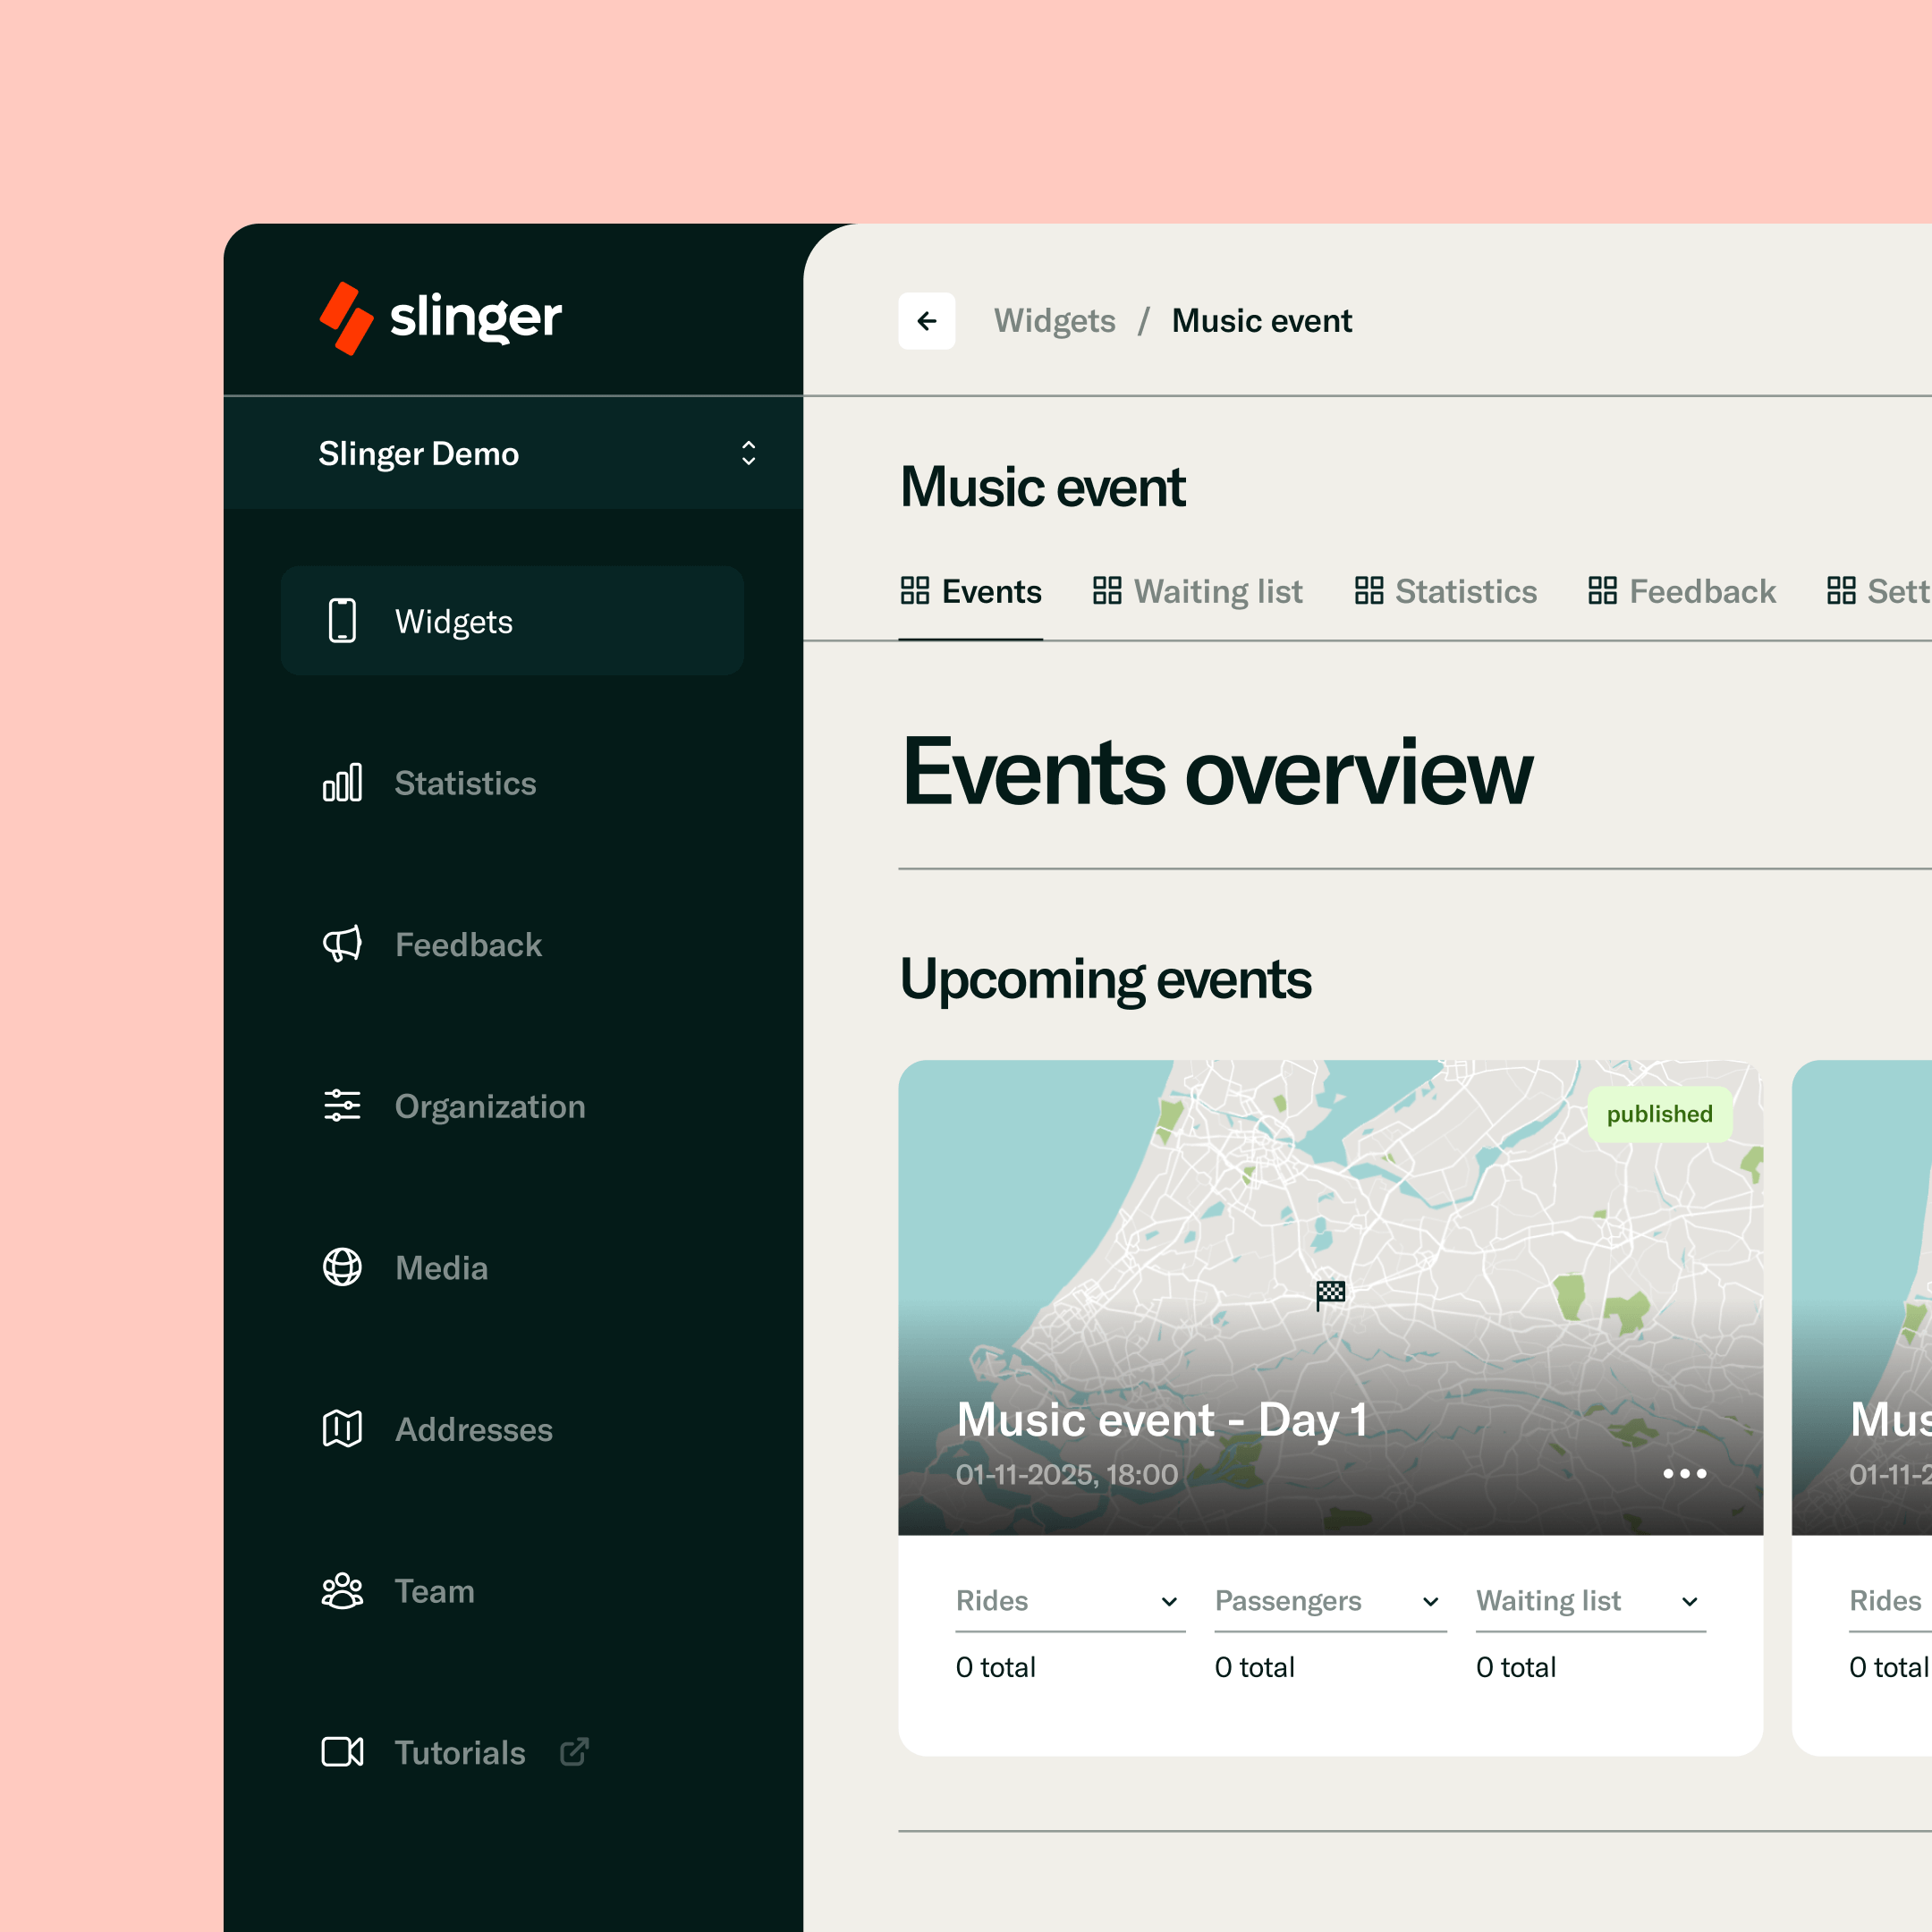
Overview of events
Real-time monitoring
Kilometers traveled
Customizable statistics
CO2 savings report
User-friendly design
Feedback collection
Dashboard languages
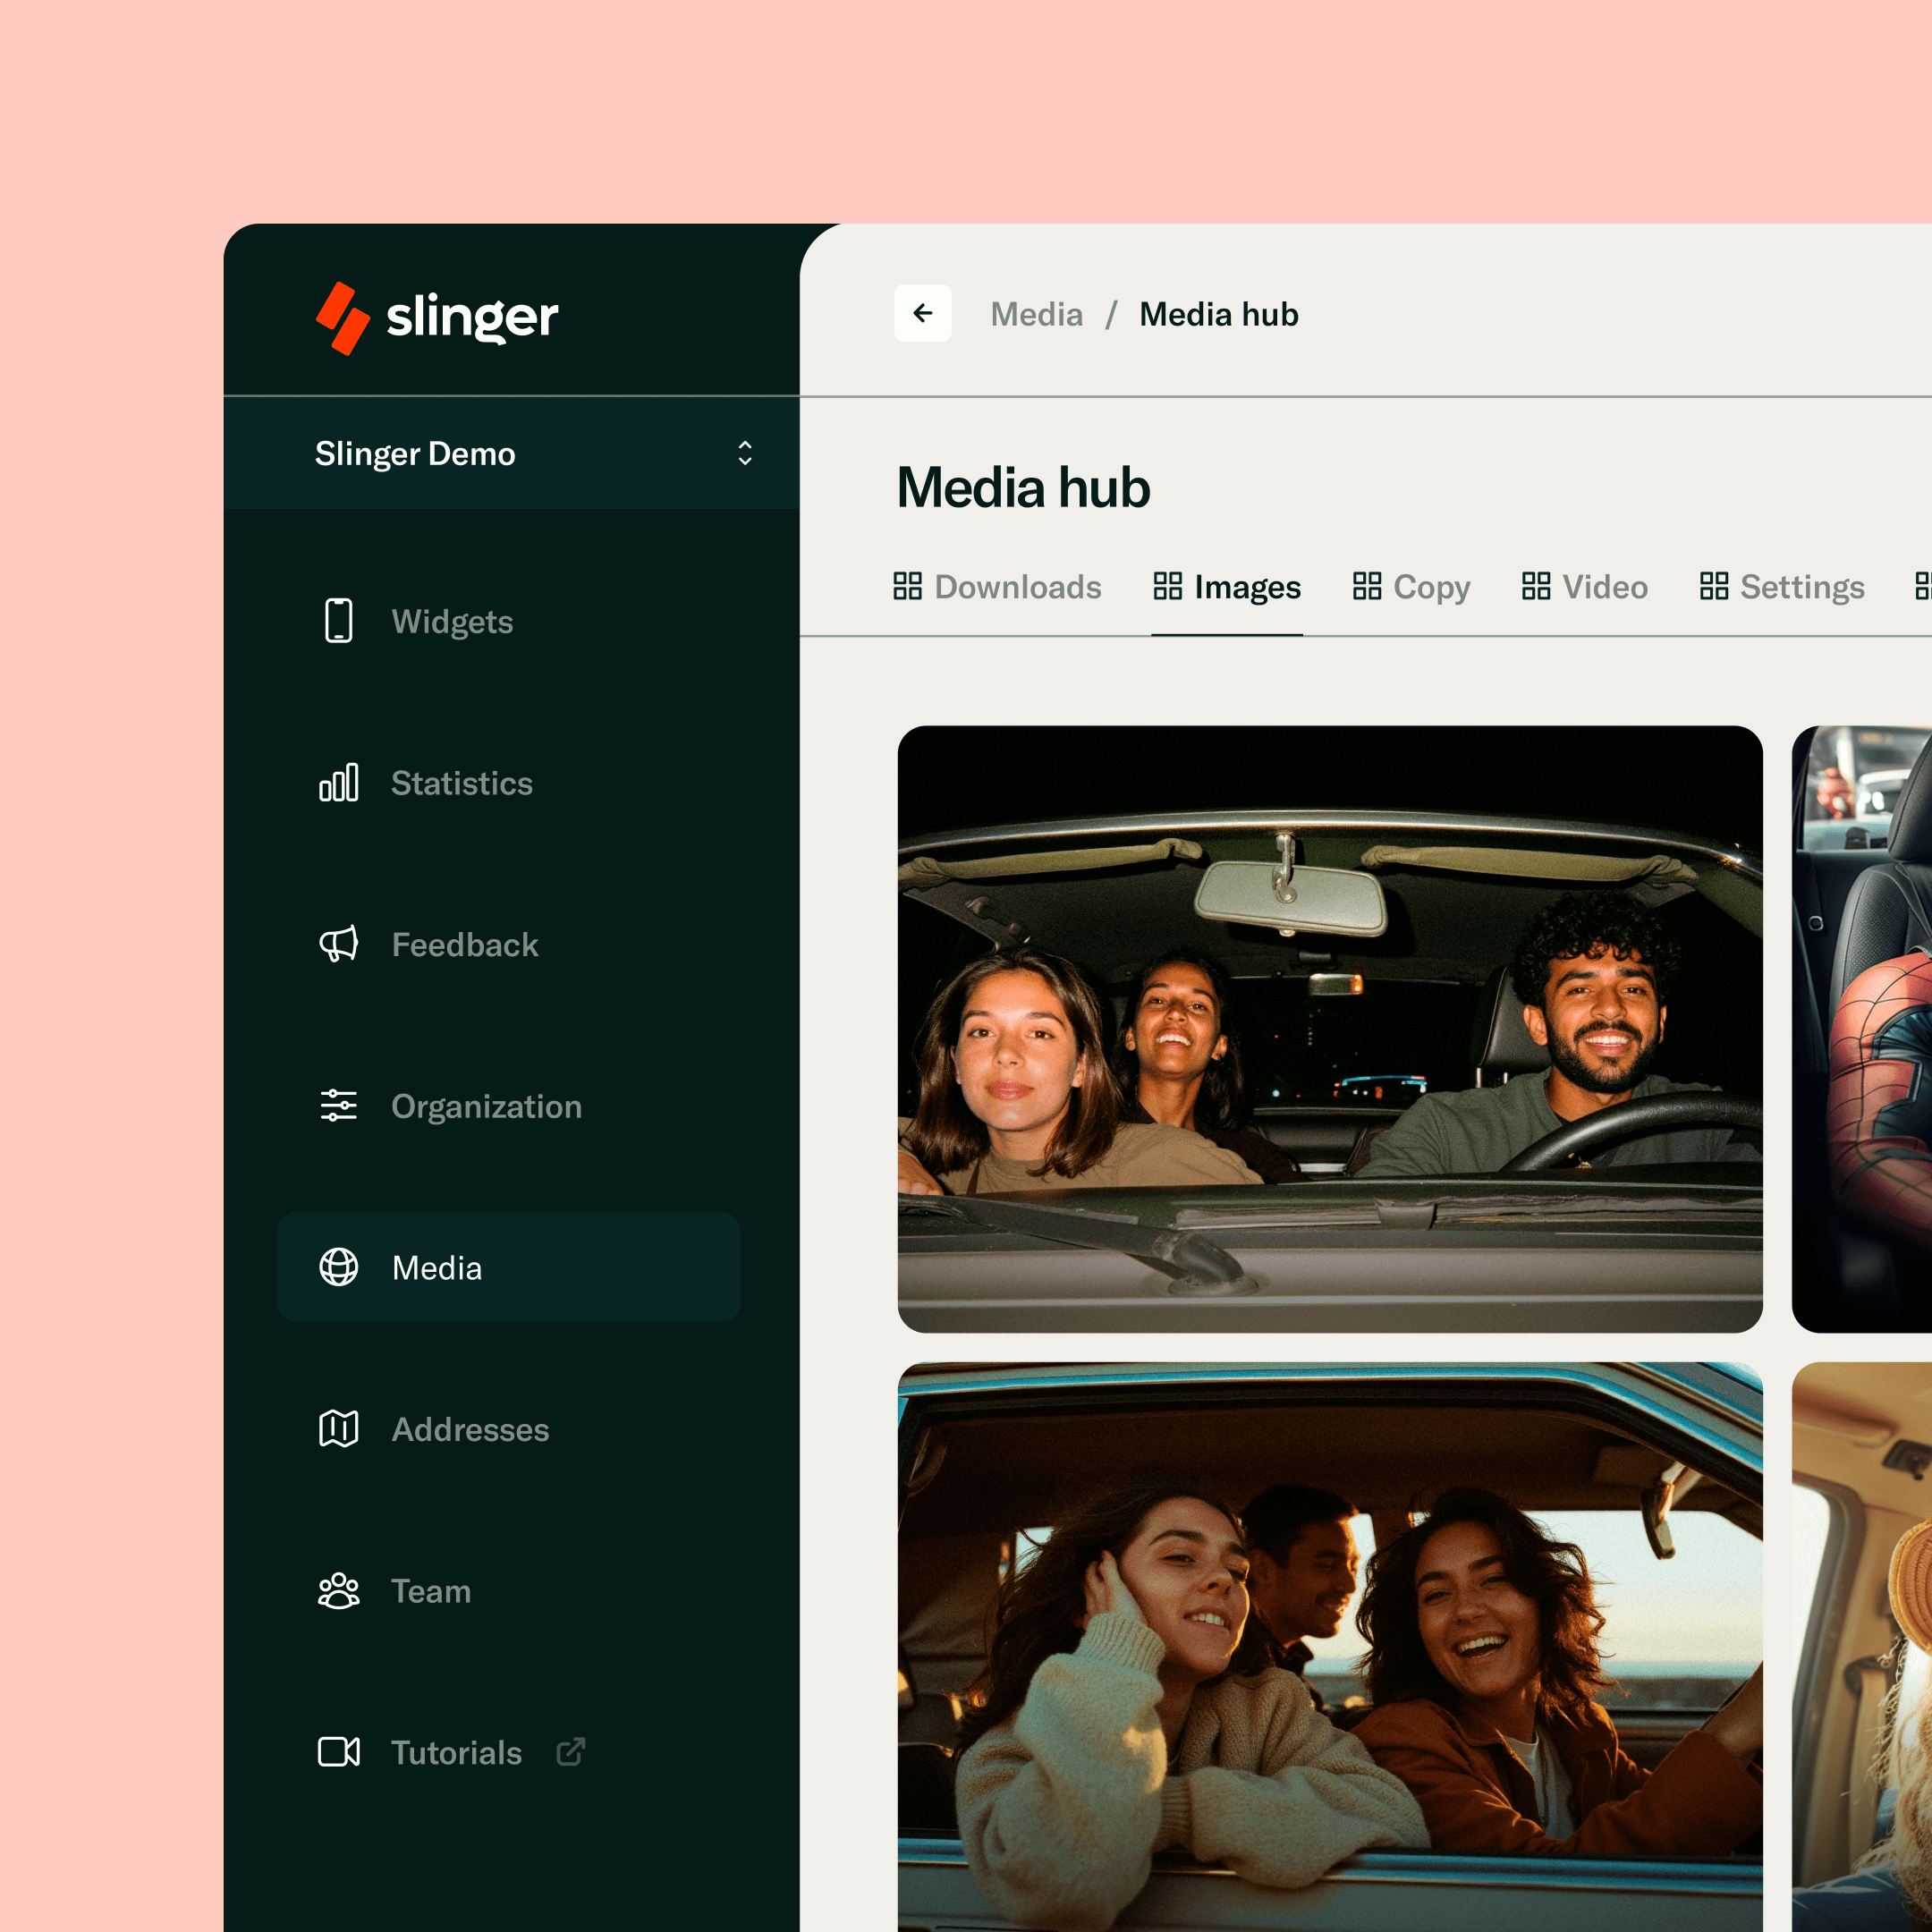
Media Hub
Team members
Map overview
Import events
Event days management
Book a free demo
Top 5 questions
Yes, you can create multiple widgets for different events or locations. Each widget has its own price, and our team can help you determine the most efficient widget strategy for your organization.
Yes, you can manage multiple events within a single widget, making it easy to use one widget for an ongoing event program.
We base calculations on the distance between departure and destination locations of participants, assuming riders would otherwise drive individually to the event. A 20% adjustment factor accounts for cases where participants would not travel alone. For CO₂ calculations, we use the average emissions of a passenger vehicle, based on the latest statistics and environmental standards.
The dashboard reports the following data to help you measure the widget’s impact: Number of rides: Unique rides organized via the widget. Kilometers saved: Total kilometers saved through shared rides. CO₂ reduction: Estimated CO₂ emissions reduction due to shared rides. User engagement: Insights into widget usage, such as ride offers, ride requests, and the percentage of users who share rides. These reports help you track the effectiveness of your ride-sharing initiative and show your organization’s contribution to sustainability.
The media hub provides royalty-free promotional materials, such as visuals and banners, designed to promote ride-sharing. Use these materials on your website, in newsletters, and on social media.

